
A dashboard can show twenty charts and still leave someone wondering, “So… what should I do?”
That person may be monitoring operations, comparing performance or investigating a problem. They need a way to understand the situation and take a useful next step. A beautiful collection of rectangles is only the beginning.
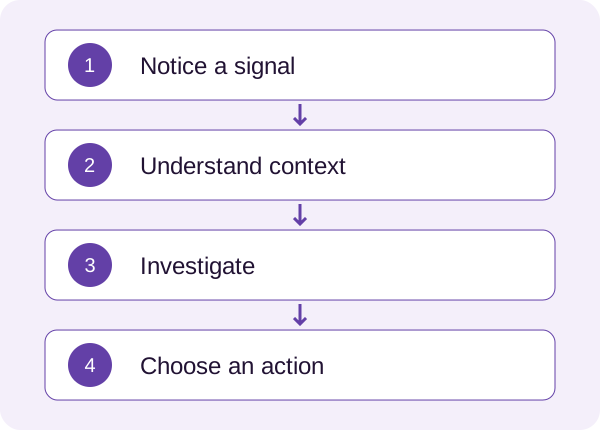
Start with the decision
Before choosing charts, write the questions the dashboard must answer. What requires attention? What changed? Is this expected? Where can someone investigate? What action are they allowed to take?
A manager comparing trends and an operator responding to an incident may need different views. Available data alone should not determine the information hierarchy.
My AI Bot Operations Dashboard case addresses operational hierarchy, visibility and investigation paths. Sharing those decisions does not imply that a chart alone produced a measured business result.
Pair the signal with context
Imagine an illustrative dashboard displaying “Response failures: 42.” The number raises several questions. Over what period? Out of how many requests? In which channel? Has anything changed?
Signal: failed responses increased during the last hour.
Context: the increase is concentrated in one channel, with the time range and data update time shown.
Next step: “Review affected conversations.”
Use comparisons appropriate to the task. A previous quiet period can make normal activity appear alarming. The example above describes a presentation pattern; its values and effectiveness need validation using the actual system.
Use attention deliberately
When every tile is highlighted, the interface asks someone to worry about everything at once. Decide what qualifies for attention and how presentation changes with severity.
Use text and structure alongside colour. A red status should explain the problem. Group related information and keep investigation close to the signal that prompted it.
Be careful with large totals. They can look reassuring while hiding a problem in a smaller segment. Provide a clear breakdown without overwhelming the initial view.
Explain the data state
Loading, empty, unavailable and zero are different states. “No incidents” and “We couldn’t load incidents” should have distinct presentations.
Show freshness when it affects a decision. Explain filter scope and permissions. If someone sees only one account or region, make that limitation visible. A correct number can still support the wrong interpretation when its context is missing.
Trace the path to action
After opening an alert, can the person examine the relevant evidence, understand the situation and perform an appropriate action? Can they return without losing their filters?
An alert that leads to a generic page completes only half the conversation.
- Name the three decisions the overview must support.
- Identify the question behind each prominent metric.
- Check period, comparison and freshness.
- Explain statuses without relying on colour alone.
- Trace one signal through investigation and action.
- Review empty, zero and failed-load states.
Use the UX prioritization approach to choose one important flow to improve.
Ask a colleague to decide what needs attention using the dashboard. Their explanation of the situation and next step will tell you far more than “Do you like the charts?”